AI & Machine Learning
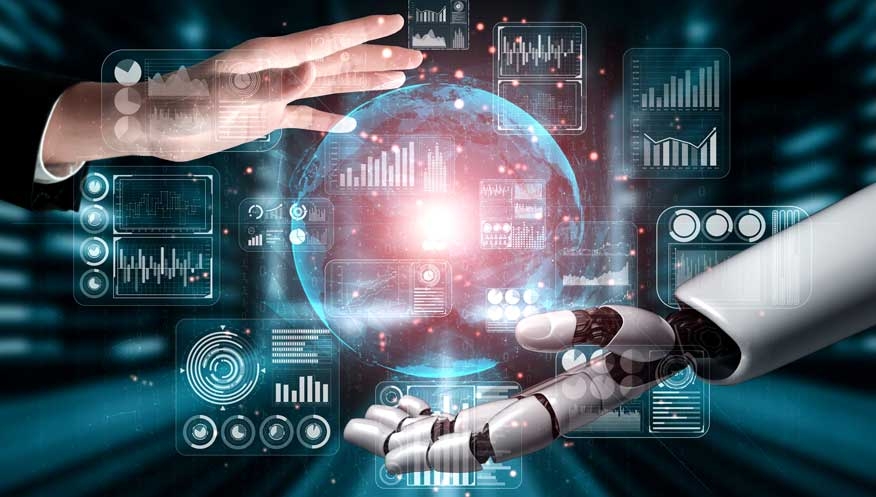
AI is a broad field that encompasses a variety of approaches and techniques for building intelligent systems. At its core, AI aims to create algorithms that can perform tasks that would normally require human-level intelligence, such as recognizing patterns, learning from data, and making decisions. Some common examples of AI include natural language processing (NLP), image recognition, and game playing.
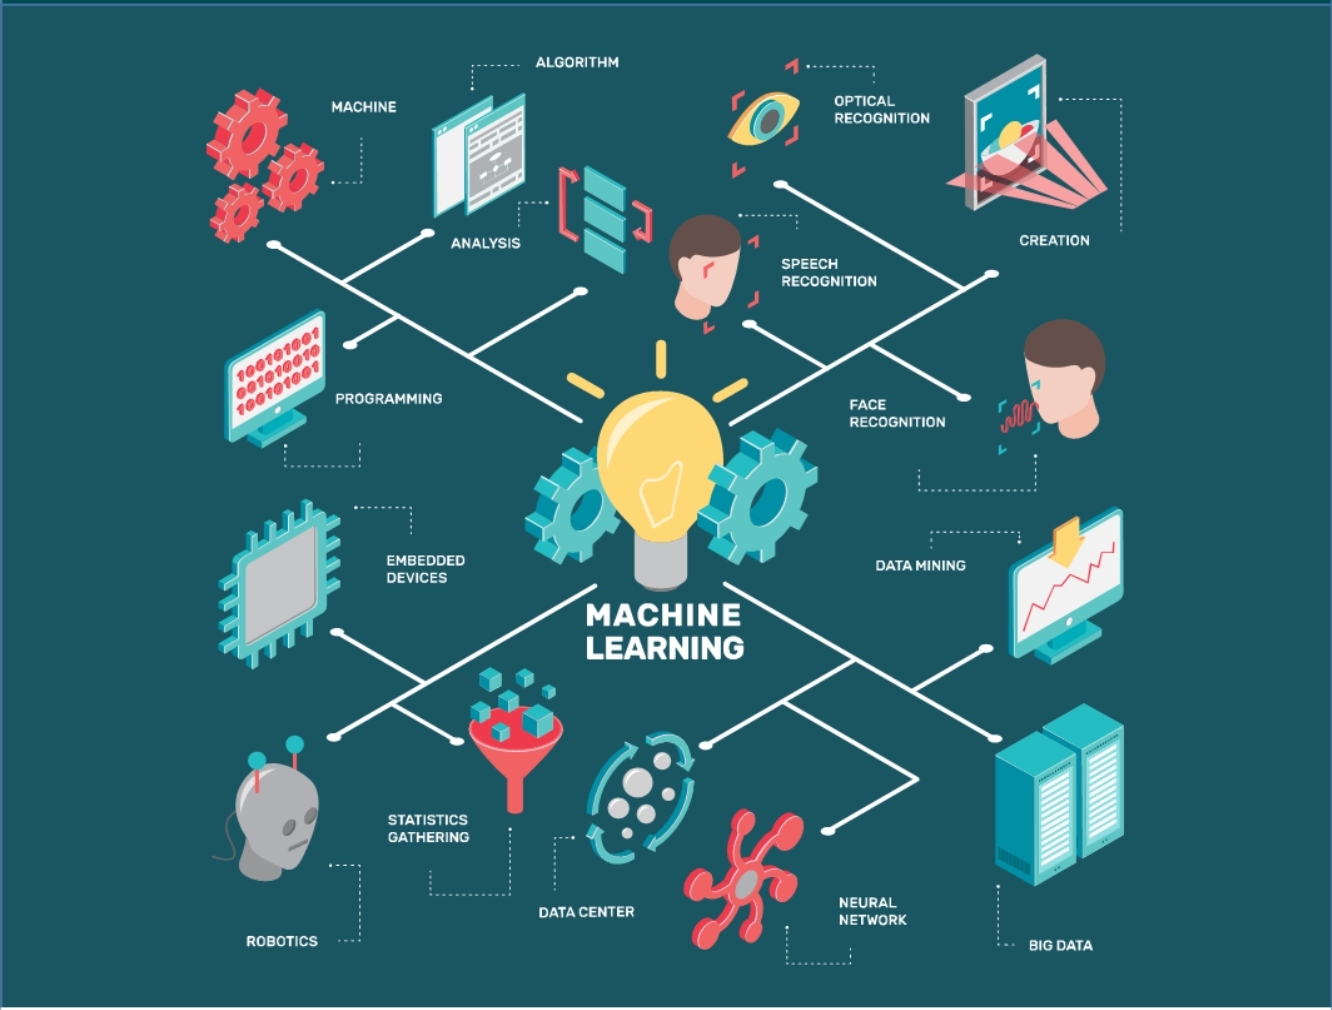
ML is a subfield of AI that involves using algorithms and statistical models to enable machines to learn from data without being explicitly programmed. ML algorithms are designed to improve their performance over time as they are exposed to more data. For example, a machine learning model might be trained to recognize faces in images bhy being fed a large dataset of images labeled with the names of the people in them. As the model is exposed to more data, it will become better at identifying faces in new images.
There are several different types of ML algorithms, including supervised learning, unsupervised learning, and reinforcement learning. In supervised learning, the training data is labeled with the correct output, and the goal is to learn a function that maps inputs to outputs. An example of a supervised learning task might be classifying emails as spam or not spam based on a dataset of labeled emails.
In unsupervised learning, the training data is not labeled, and the goal is to discover patterns or relationships in the data. An example of an unsupervised learning task might be clustering a dataset of customer data into groups based on common characteristics.
Reinforcement learning is a type of ML in which an agent learns by interacting with its environment and receiving rewards or punishments based on its actions. An example of reinforcement learning might be a robot learning to navigate a maze by trial and error.
AI and ML have a wide range of applications in a variety of fields, including healthcare, finance, transportation, and manufacturing. For example, AI and ML can be used to analyze medical images for early detection of diseases, automate financial trading, improve logistics and supply chain management, and optimize manufacturing processes.
Few examples are as:-
1. Autonomous vehicles: AI and ML can be used to enable self-driving cars and other autonomous vehicles to navigate roads, avoid obstacles, and make decisions in real-time.
2. Medical diagnosis: AI and ML can be used to analyze medical images, such as X-rays and CT scans, to detect early signs of diseases or abnormalities. This can enable early diagnosis and treatment, improving patient outcomes.
3. Personalized medicine: AI and ML can be used to analyze patient data, such as medical records and genetic data, to identify personalized treatment options for individual patients.
4. Financial fraud detection: AI and ML can be used to analyze financial transactions in real-time to detect patterns indicative of fraud, enabling early detection and prevention of fraudulent activities.
5. Predictive analytics: AI and ML can be used to analyze data from a variety of sources to make predictions about future events or trends. This can be used, for example, to improve supply chain management or optimize marketing campaigns.
6. Natural language processing: AI and ML can be used to enable intelligent systems to understand and respond to human language, enabling applications such as voice-activated assistants or intelligent chatbots, AI powered blog writing, text modification, language transation, information extraction etc.
7.Personalization: AI can be used to personalize the shopping experience for individual customers based on their past purchases, browsing history, and other data. This can include recommendations for products or services, customized email and advertising campaigns, and personalized search results.
In conclusion, AI and ML are complex and rapidly evolving fields that have the potential to revolutionize a wide range of industries and applications. As more data becomes available and new techniques are developed, we can expect to see even more exciting advances in the field in the future. Image Source
Dashboard Creation
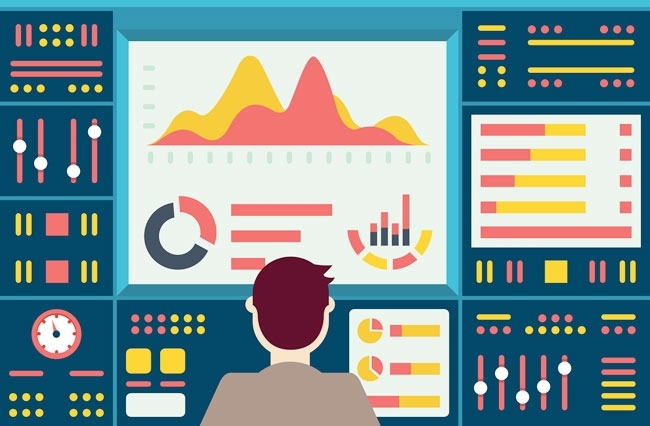
Analytics dashboard creation refers to the process of designing and building a custom interface that allows users to access, visualize, and analyze data in real time. Analytics dashboards are often used in business settings to help managers and other stakeholders make more informed decisions by providing easy access to key performance indicators (KPIs) and other key data.
To create an analytics dashboard, designers and developers typically work together to define the data that will be included in the dashboard, as well as the layout, visualizations, and other features of the dashboard. They may also work with data analysts to ensure that the data is accurate and up-to-date.
The process of creating an analytics dashboard typically involves several steps, including:
Defining the goals and objectives of the dashboard: This involves identifying the key business questions that the dashboard is intended to answer and the key performance indicators (KPIs) that will be used to measure success.
1. Identifying the data sources: This involves identifying the data sources that will be used to populate the dashboard, such as databases, spreadsheets, or APIs.
2. Cleaning and preparing the data: This involves cleansing and formatting the data to ensure that it is accurate and ready for analysis.
3. Designing the layout and visualizations: This involves deciding on the layout and appearance of the dashboard, as well as the types of charts, graphs, and other visualizations that will be used to display the data.
4. Building and testing the dashboard: This involves using software tools to build the dashboard and test it to ensure that it is working as intended.
Case Study: Analytics Dashboard Creation for a Manufacturing Company
A manufacturing company decided to create an analytics dashboard to improve its decision-making and operational efficiency. The company had a large amount of data on its production processes, including machine utilization, production output, and employee performance, but it was struggling to make sense of this data and use it to inform its business decisions.
To address this problem, the company worked with a data analytics consulting firm to design and build a custom analytics dashboard. The dashboard was designed to allow the company's managers to easily access and analyze key performance indicators (KPIs) and other key data in real time. It included a range of interactive charts and graphs that allowed managers to drill down into the data to understand trends and patterns, and to compare data across different departments and periods.
The analytics dashboard had several benefits for the company. It provided a centralized, easy-to-use interface for accessing and analyzing data, which helped managers to make more informed decisions and identify opportunities for improvement. It also helped to improve communication and collaboration within the company, as managers could share data and insights more easily.
Overall, the creation of an analytics dashboard had a positive impact on the company's operations and decision-making. It helped the company to better understand its business and identify areas for improvement, leading to increased efficiency and profitability. Image Source
Image Analytics
Image analytics is a powerful and rapidly growing area of artificial intelligence and machine learning that is revolutionizing many different industries and sectors.
There are many real-life use cases for image processing and analytics, ranging from practical applications in industry and business to scientific and research applications. Some examples of how image processing and analytics are being used in real-life applications include:
Computer vision and robotics: Image processing and analytics are essential for tasks such as object recognition, object tracking, and scene understanding in the field of computer vision, and are widely used in robotics applications such as self-driving cars and drones.
Medical imaging: Image processing and analytics are used in a variety of medical applications, including image-guided surgery, diagnostic imaging, and patient monitoring.
Surveillance and security: Image processing and analytics are used to analyze video footage and identify patterns, trends, and potential threats in the field of surveillance and security.
Retail and e-commerce: Image processing and analytics are used to analyze product images and video to identify trends, optimize product placement and marketing, and improve customer experience.
Agriculture: Image processing and analytics are used to analyze satellite and drone imagery to monitor crop health, identify pests and diseases, and optimize irrigation and fertilization.
Image analytics in Surveillance and security:-
Image analytics using facial recognition technology is a type of AI that involves using computer algorithms to analyze and recognize human faces from digital images or video. This technology has a wide range of potential applications, including security, where it can be used to identify individuals in real-time for access control or surveillance purposes.
To work effectively, facial recognition systems typically require a large dataset of images of faces to be used for training the algorithms. These images are usually labeled with identifying information, such as the name of the person or a unique identifier, which allows the system to learn to recognize specific individuals.
Facial recognition technology has the potential to improve security in a number of ways, such as by enabling automatic identification of individuals at border crossings, airports, and other secure locations, or by helping to identify and track individuals in real-time in public spaces.
One example of the use of image analytics in facial recognition is the deployment of a system by the Metropolitan Police in London, UK. The system was designed to help identify individuals in real-time as they moved through public spaces, with the goal of detecting and preventing crime.
To use the system, police officers would input a photograph of an individual they wanted to track into the system, and the system would then scan live video feeds from cameras located around the city to try to identify the individual. If a match was found, the system would alert the officers, who could then take appropriate action, such as stopping and questioning the individual or following them to gather more information.
So image analytics using facial recognition technology can have many legitimate and valuable uses in a range of settings, including security, law enforcement, and other areas where the ability to accurately identify individuals is important. However, it is important for organizations to carefully consider the potential risks and benefits of using this technology, as well as to ensure that appropriate safeguards are in place to protect privacy and prevent misuse.
Image analytics in Retail and e-commerce:-
Another real-world example of the use of image analytics is in the retail industry, where it is being used to optimize the layout and display of products in stores.
In this case, image analytics algorithms are used to analyze images of store shelves and displays to identify patterns and trends in how customers interact with the products. This can include information on which products are most popular, how long customers spend looking at particular products, and which products are most likely to be purchased.
Using this information, retailers can then optimize the layout and display of products in their stores to increase sales and improve the shopping experience for customers. For example, they might rearrange the layout of products on shelves to make it easier for customers to find what they are looking for, or they might move high-selling products to more prominent locations in the store.
Overall, the use of image analytics in retail can help businesses to better understand customer behavior and preferences, and to use this knowledge to increase sales and improve the customer experience. However, it is important for retailers to consider the potential privacy implications of collecting and analyzing images of customers in their stores. Image Source
Text Analytics
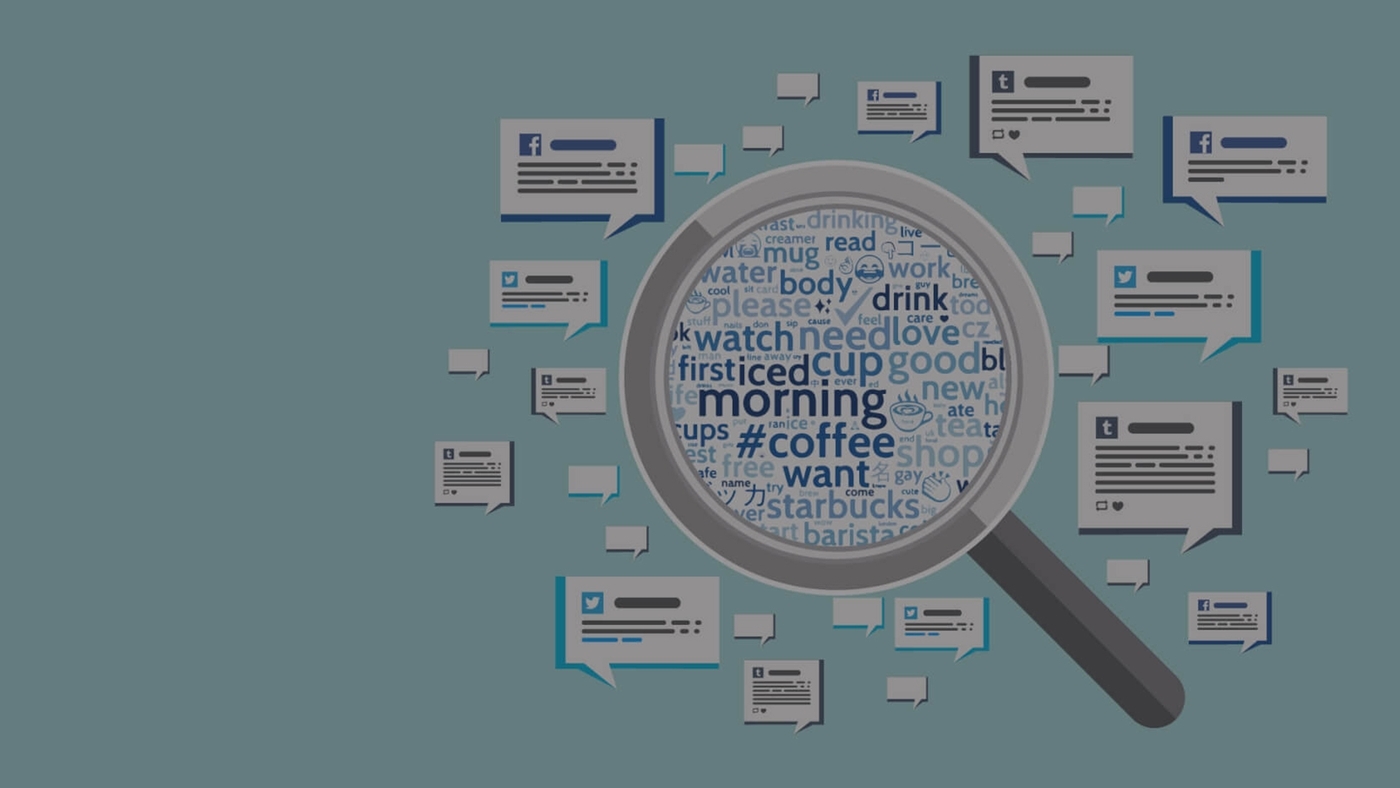
Text analytics is the process of using artificial intelligence and machine learning algorithms to analyze and extract information from text data. This can involve tasks such as text classification (e.g. identifying the topic or sentiment of a piece of text), entity extraction (e.g. identifying and extracting specific names, dates, or locations from text), and language translation (e.g. translating text from one language to another).
Text analysis is a process of extracting meaningful insights from text data using established patterns and trends. It involves structured analysis of the relevant data and can be done using various techniques, including linguistic, statistical, sentimental, semantic, and taxonomic analysis. Text analysis tools can help process large amounts of data from the internet and extract hidden or abstract information using machine learning technologies. This information can be used in various fields, including research and development, marketing and advertising, intellectual property, intelligence, life sciences, and social media monitoring.
There are many modern applications of text analytics, and the field is constantly evolving as new techniques and technologies are developed. Some examples of current and emerging applications of text analytics include:
1. Social media analysis: Text analytics can be used to analyze social media posts and conversations to understand the public sentiment, identify trends and patterns, and gather insights about consumer behavior and preferences.
2. Customer service and support: Text analytics can be used to analyze customer feedback, reviews, and support requests to identify areas for improvement, resolve issues more efficiently, and improve customer satisfaction.
3. Marketing and advertising: Text analytics can be used to analyze customer reviews, social media posts, and other forms of customer feedback to understand consumer preferences and behavior, and to optimize marketing and advertising campaigns.
4. Risk assessment and fraud detection: Text analytics can be used to analyze large volumes of text data, such as financial transactions or customer interactions, to identify patterns and trends that may indicate risk or fraudulent activity.
5. Healthcare: Text analytics can be used to analyze electronic medical records, clinical notes, and other forms of healthcare data to extract important information, identify trends and patterns, and improve patient care.
6. Legal: Text analytics can be used to analyze legal documents, contracts, and other forms of legal text to identify important terms, extract key information, and assist with legal research and analysis.
7. Education: Text analytics can be used to analyze student writing and feedback to identify areas for improvement, assess the effectiveness of teaching methods, and measure student progress.
8. Human resources: Text analytics can be used to analyze resumes, job descriptions, and employee feedback to identify trends and patterns, and to optimize hiring and retention practices.
Case Study: Text Analytics in Customer Service and support
A large online retailer decided to use text analytics to improve the efficiency and effectiveness of its customer service department. The company's customer service representatives received a high volume of inquiries via email and social media, and the company wanted to find a way to better understand and respond to these inquiries in a timely and helpful manner.
To do this, the company implemented a text analytics system that analyzed the content of customer inquiries and automatically assigned them to appropriate categories based on the topic of the inquiry. For example, inquiries about order tracking were automatically routed to the order tracking team, while inquiries about returns were routed to the returns team.
The text analytics system also automatically generated responses to common inquiries, such as how to track an order or how to return an item. These responses were reviewed by human customer service representatives to ensure their accuracy and helpfulness, and were then sent to customers automatically.
The implementation of the text analytics system had a number of benefits for the company's customer service department. It reduced the workload of human customer service representatives by automating many routine tasks, allowing them to focus on more complex inquiries. It also improved the speed and accuracy of responses to customers, leading to higher levels of customer satisfaction.
Overall, the use of text analytics in customer service helped the company to improve efficiency and effectiveness, leading to cost savings and increased profits. It also helped the company to better understand and respond to the needs of its customers, leading to improved customer loyalty and retention. Image Source
Application of Machine Learning Algorithm
Consumer-deviant behavior costs global utility firms USD 96 billion yearly, attributable to Non-Technical Losses (NTLs). NTLs affect the operations of power systems by overloading lines and transformers, resulting in voltage imbalances and, thereby, impacting services. They also impact the electricity price paid by the honest customers. Traditional meters constitute 98 % of the total electricity meters in India. This paper argues that while traditional meters have their limitation in checking consumer-deviant behavior, this issue can be resolved with ML-based algorithms. These algorithms can predict suspected cases of theft with reasonable certainty, thereby enabling distribution companies to save money and provide consistent and dependable services to honest customers at reasonable costs. The key learning from this paper is that even if data is noisy, it is possible to create a Machine Learning Model to detect NTL with 80 percentage plus accuracy. Image Source
